Acronym key
- AI
- Artificial Intelligence
- AM
- Analysis Machine
- API
- Application Programming Interface
- AR
- Analysis Request
- II
- Intelligence Interface
- MHDB
- Metric History Database
- MHM
- Metric History Machine
- RC
- Results Contract
- VI
- Visual Interface
Slice 3: Metrics and History
Summary and structure
Slice 3 establishes the machinery for requesting, calculating and presenting BFshop's foundational business metrics.
Its central architectural elements are the Analysis Request, the Analysis Machine, metric history, and the Results Contract.
Although chart controls and query interfaces belong conceptually to Slice 5, limited versions are developed here so Slice 3's analytical machinery can be tested.
Slice 3 is currently under construction and in its current form it contains two pieces of code for retrieving data from the databases, a frontend interface for sending queries to those pieces of code.
The next stages are to establish data shapes that will allow for a repeatable structure for data representation.
Evolution
The first thing to establish was 'what is this slice actually trying to achieve?'
The first goal was to have basic business metrics calculated so they can be presented as graphs. See section 1 to read further detail on this.
The second goal was to be able to test variable queries, such as 'how much revenue came from males between x and y dates?'.
The first goal could be achieved by having ready to go charts where each is rendered by calls to an API and shows its particular set of data.
The second goal is more complex because it introduces variety of queries.
I needed a way of testing queries, so a visual interface was needed, forcing this slice into territory of Slice 5: Intelligence Interface.
It made sense that this visual interface (VI from hereon) would serve in place of the eventual merchant interface in /merchant/data, and also in the project portal, so site visitors are immediately presented with the current stage of the project. Two copies of the same interface with the same inputs and using the same datasets.
So, as both goals required querying a dataset, differing only in the variability of the queries, and the VI was to represent the progress in the analysis process and the progress towards a final user interface, it became clear that this slice would rely upon a structure, or a process, by which the data can be queried, and filtered on its properties.
This sounds obvious, and it is, but what I refer to is a scaffold on which the project will rest, a set of boundaries on whose sides different services and functions will reside, interacting to allow for variety in input and output.
This approach allows for simplicity to start with room for added depth later (a concept on which BFshop has so far been built).
Development
Data Foundations and Analysis Machine
The first thing was to define the data foundations and how these would be dissected for different views on the data. (I failed to conceive of the later-realised and highly important Analysis Request and Results Contract.)
Three 'layers' of information were roughly defined:
Totals: Direct measurements of business activity, such as revenue, orders, items sold and customers*
Derivations: New information calculated from one or more totals, such as average order value, revenue per customer, percentage change and rolling averages
Filters: Conditions used to limit which records contribute to totals and derivations, such as period, gender, age, location, product or category
*customers are currently deferred for simplicity
Totals would be orders, customers, items sold, and revenue. These could then be filtered by time, person (gender, location, age) and product (product id, category).
A great deal of debate was had on a number of questions:
- How should various elements be both separate and collaborative with one another?
- How should meaningful patterns and relationships be identified without mistaking randomness for something important (slice 4 territory)?
- What should be calculated on demand vs prior to being asked?
- What should be stored historically and at what level of detail?
- How can deterministic tools be used to minimize the scope of AI?
It was soon realized that an architecture involving a central piece of machinery would be needed to draw together the totals and the filtering devices.
From this the analysis machine (AM) was built.
Then I realized that with such a machine, the output would be determined by the input, rather than the initial idea of applying filters to predefined totals.
So the analysis machine is effectively a service, similar to placeOrderService.
The AM would extract all orders, along with the related customer and order items, from the database (not a long term ideal solution but acceptable for a learning project), and filter by whichever arguments were passed into the AM representing filters.
It was soon realized that filtering by time, or period as it will be now referred to, is too fundamental to have period included in filters; the reasoning being that without a time dimension (in the absence of different data entities or sources such as in the case of comparisons) a historical metric is reduced to a single total rather than a series showing change. And so historical charts, such as would form the basis of most charts in an analytics workspace, would always need to be filtered by period.
As a result of this the data entity going into the AM was properly defined:
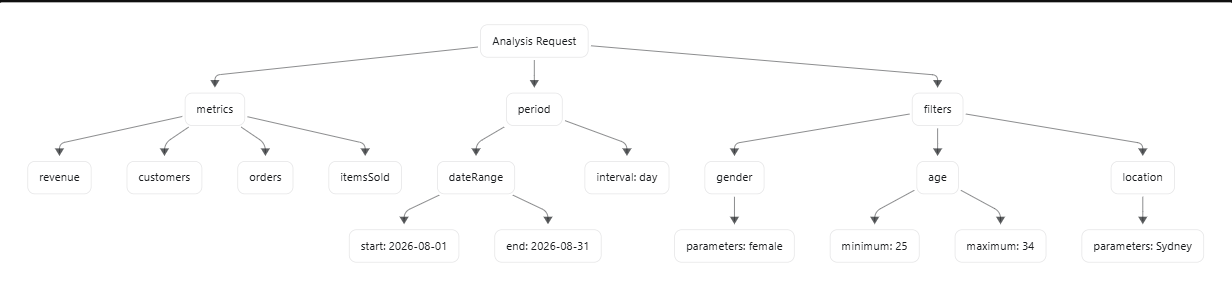
Period is on the same level within Analysis Request as metric and filters, reflecting its importance. This object is absolutely fundamental to slice 3 and gives us an object around which we can build the rest of the machinery.
(I now recognize that the period object needs to be reshaped and so this shape is not final).
A charting package was installed and the VI was built as means for testing the AM. This was the first step in creating an instance of a VI, or at the least a way of testing the AM
Metric History
The idea of persisted data was always in the periphery; it made sense to save some form of the AM's output.
This idea was realized as the solution to the limitation of the VI; it could only produce one data point per query; filtering revenue by date added the revenue of each day in that period and returned it as one number. A solid first step but not much use for eCommerce merchants.
Persisted data was the answer.
And the AM provided the perfect way to create that.
It was decided that the Metric History Machine (MHM) was to be a similar device to the AM, but focused on 'simpler' and historical data, drawing from a (at this point imaginary) database where each row would represent a day and each column a total (revenue, orders, etc) for that day.
The MHM would retrieve individual values for specific days, providing historical data.
This was done as a new machine rather than an extension of the AM for separation of concerns.
For this to fit in three main things were needed:
- The actual persisted data
- Some mechanism for queries to reach either the AM or the MHM
- A shared data shape
- This one was simple; an n8n automation runs daily and sends a date to an API endpoint. A snapshot service constructs a request for the AM, running it for revenue, orders and items sold. The results are written to the Metric History Database (MHDB). All that is needed is time (supposing it all works).
- A 'request router' function was built between the AM and API, where the request (more on the request later) is assessed; if the request contains only metric and period (such as orders placed in July) then it goes to the MHM. If it also contains a filter it goes to the AM.
- This led me to the realization on how fundamental data is to the project, and how the shape of the data coming down in the query and the data being sent back up in response, should have been determined among the very first things when building this slice. The next section will focus on these.
Data entities and chart building scaffolding
I realized the data entities passing up and down the chain would be fundamental to the earlier mentioning of a 'structure, or a process, by which the data can be queried, and filtered on its properties', which itself would be a step towards a standardized chart creation architecture.
This led me to realise that chart creation variability could be achieved by mapping properties of a returning data structure to the visuals of a chart or the data shown on it; the title property becomes the title of the chart, a series of values becomes the plotted data.
This birthed the need to standardize two data shapes which together could be used universally in the project to call up almost any chart.
These are the results contract (RC) and the analysis request (AR). The AR would be populated with a query (for example revenue for a certain period from males), and the returning RC would include the information needed to produce a chart showing that information.
The ultimate variability in the RC and AR would allow for enormous variability in chart creation, providing an architecture which could be used throughout the project for calling up information, as well as providing visual analysis (in the case of overlaid averages, comparisons, breakdowns and scatter plots) without even creating actual analysis machinery.
Structural Changes
I soon realized the AM could be used for all the current data retrieval. The MHM was redundant, but having daily snapshots of the metrics (the MHDB) would still be useful at some point.
All queries were rewired to go through the AM, and it was rebuilt to create custom database queries for only the given request, where it had been previously extracting all data and extracting from that, which was never a final solution.
This also brought into name the role of the AM, as it itself was no longer an analysis machine; its actual behaviour involved the calling of different functions such as totals and interval calculations and of course the database operation. It was renamed to metricAnalysisService. This is better because it correctly calls it a service but not perfect as it does not do analysis.